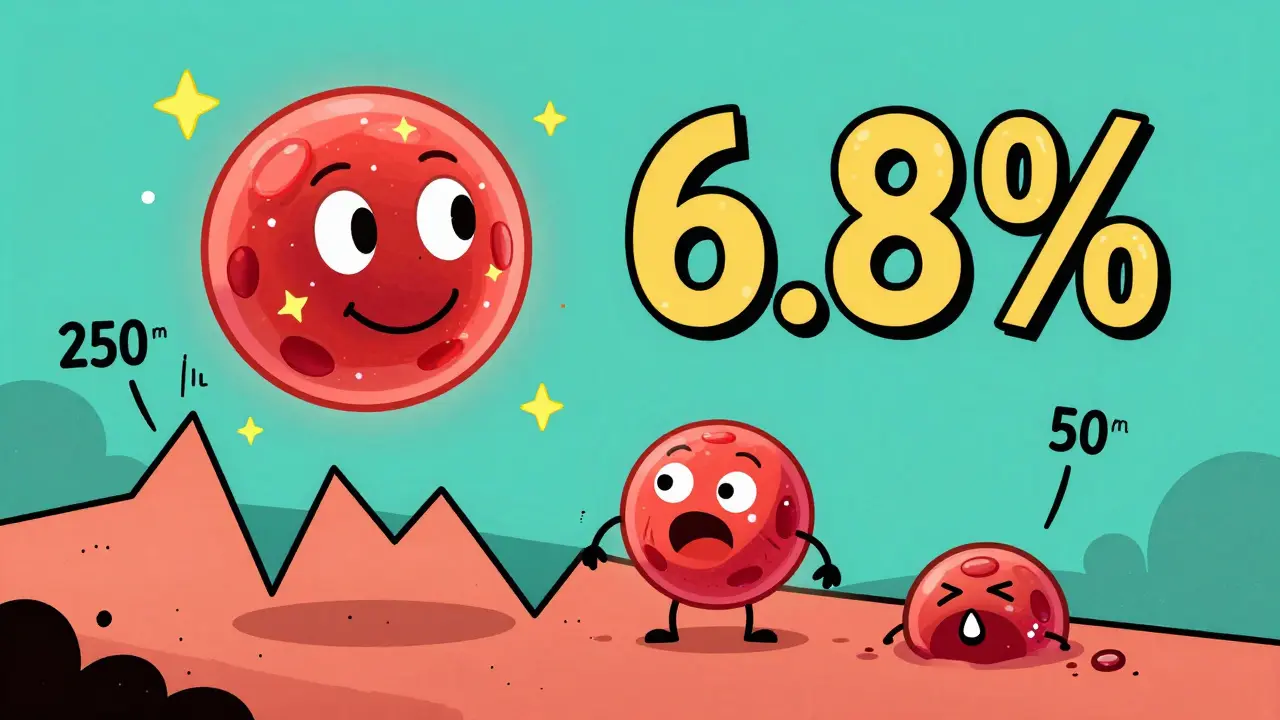
Think your A1C of 6.8% means you’re doing great? Maybe. But what if your blood sugar is crashing to 50 mg/dL three times a week and spiking to 250 mg/dL after every meal? That’s the hidden problem with relying on A1C alone. It’s not wrong-it’s incomplete. Understanding the difference between your A1C and your average glucose isn’t just about reading numbers. It’s about seeing the full picture of how your body handles sugar every single day.
What A1C Actually Measures
A1C, or HbA1c, is a lab test that shows your average blood glucose over the past 2 to 3 months. It works because glucose sticks to hemoglobin, the protein in your red blood cells. The more glucose in your blood, the more sticks. Since red blood cells live about 120 days, your A1C reflects a long-term average-not just yesterday’s spike or last night’s low.
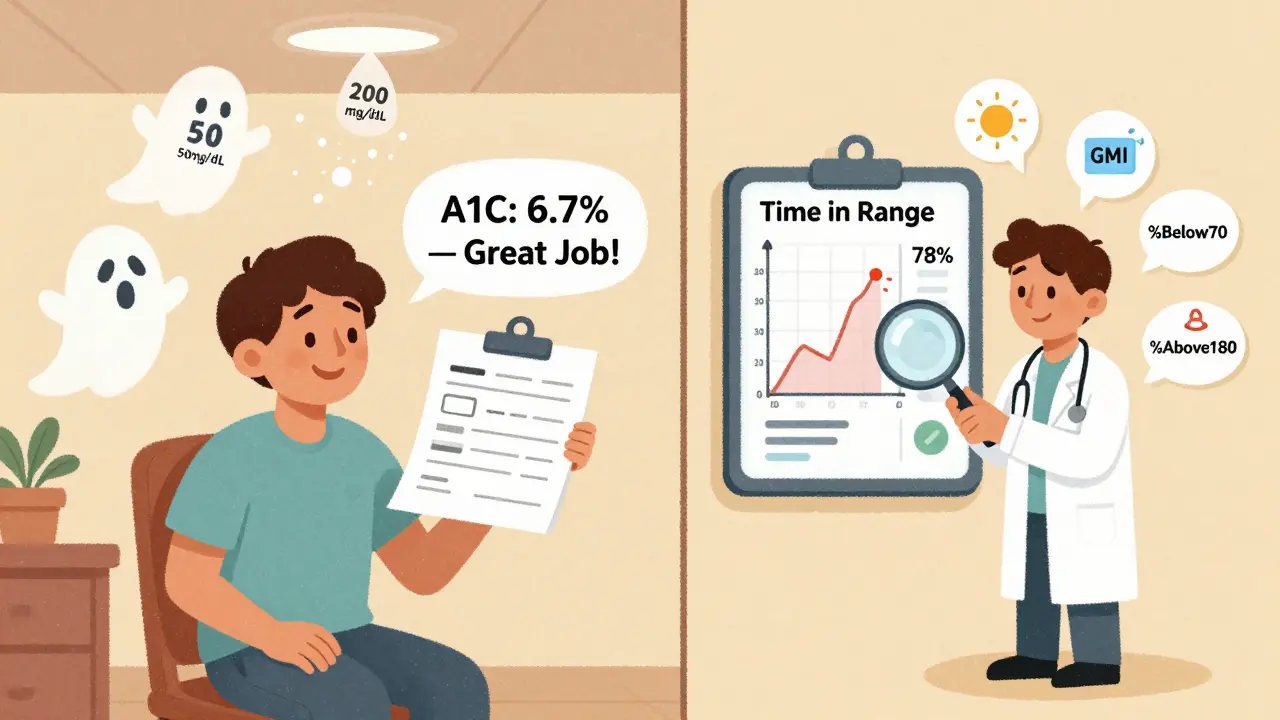
The American Diabetes Association says an A1C of 6.5% or higher is diagnostic for diabetes. For most adults with diabetes, the target is under 7.0%. But here’s the catch: that number doesn’t tell you how often you’re going low or how wild your swings are. Someone could have an A1C of 6.7% and still be spending 8% of their day below 70 mg/dL-dangerously low-and another 20% above 180 mg/dL. The A1C smooths it all out.
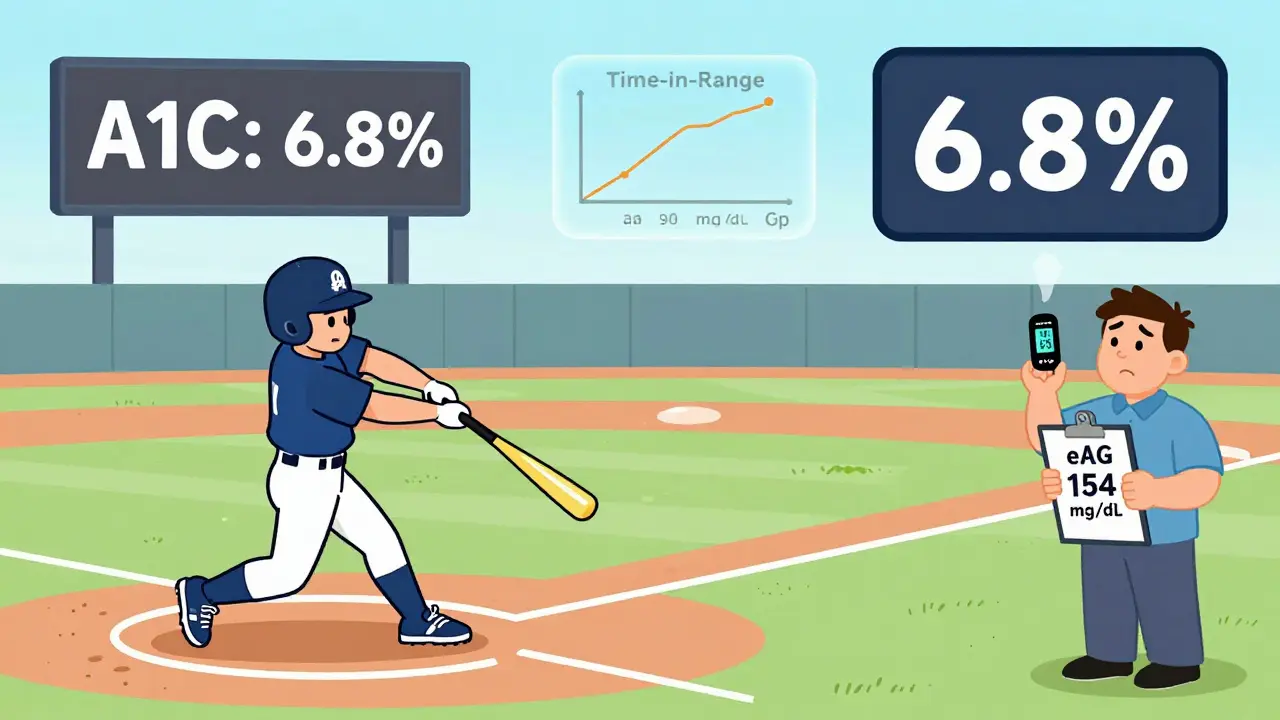
That’s why doctors now look at more than just A1C. A1C is like a season batting average in baseball. It tells you how well you performed overall, but not whether you struck out in the 9th inning or hit a home run in the 2nd. You need the game-by-game stats to know what’s really going on.
What Is Average Glucose-and How Is It Calculated?
When you check your blood sugar with a meter or a continuous glucose monitor (CGM), you’re seeing your average glucose in real time. But that number can be confusing because it’s in mg/dL, while your A1C is a percentage. That’s where eAG (estimated average glucose) comes in.
The formula is simple: eAG (mg/dL) = 28.7 × A1C - 46.7. So:
- A1C 6.0% = 126 mg/dL
- A1C 7.0% = 154 mg/dL
- A1C 8.0% = 183 mg/dL
- A1C 9.0% = 212 mg/dL
This conversion was developed by the ADAG study in 2008, based on data from over 500 people who checked their blood sugar 7-8 times a day for three months. It’s not magic-it’s math. And it’s designed to help you connect the dots between your daily readings and your lab result.
Now there’s a newer version called GMI (Glucose Management Indicator). It’s calculated the same way, but it’s pulled directly from your CGM data. If you wear a CGM for 14 days or more, your device can calculate your GMI. It’s more accurate than eAG because it uses hundreds or thousands of data points instead of a few fingersticks.
Why A1C and Average Glucose Don’t Always Match
Here’s the real issue: your A1C and your average glucose don’t always line up-and when they don’t, it’s a red flag.
Take a person with type 1 diabetes who checks their blood sugar 4 times a day. They see averages of 140 mg/dL, so they think they’re doing fine. Their A1C comes back at 7.2%. The eAG formula says that should be 154 mg/dL. But their CGM shows they’re spending 12% of the day below 70 mg/dL and 30% above 180 mg/dL. That’s a lot of swings. The average is 140, but the swings are dangerous.
A 2021 study of nearly 6,000 people found that A1C and CGM-derived GMI often differed by 0.1% to 0.5%. In some cases, the difference was over 1%. Why? Because A1C doesn’t see spikes or lows. It just averages. If you’re having frequent hypoglycemia, your A1C might look good while you’re actually at risk.
One patient from the Diabetes Daily forum said: “My A1C was 6.8%. My doctor said I was doing great. But my CGM showed I was below 70 mg/dL for 8% of the time. I passed out once last month. He didn’t even ask about lows.”
That’s not rare. A 2021 survey by Diabetes Sisters found that 31% of people had hypoglycemia episodes ignored because their A1C was in target. That’s dangerous.
When A1C Can Be Misleading
A1C is a powerful tool, but it’s not perfect. Certain conditions can throw it off:
- Anemia (especially iron-deficiency or hemolytic) can make A1C falsely low or high.
- Kidney disease can extend red blood cell life, making A1C higher than your actual glucose levels.
- Pregnancy changes red blood cell turnover, so A1C is less reliable.
- Recent blood transfusions can reset the clock and give a misleadingly low result.
And even if your body is normal, A1C still misses the big picture: glycemic variability. Two people can have the same A1C, but one has stable glucose all day, and the other swings wildly. The one with wild swings has higher risk of nerve damage, eye problems, and heart disease-even if their A1C looks fine.
Research from diabetesjournals.org shows A1C misses 60-70% of undiagnosed diabetes cases compared to fasting glucose or oral glucose tests. That’s because some people only spike after meals. Their fasting levels look normal, their A1C is under 6.5%, but their post-meal glucose is hitting 200 mg/dL regularly. That’s prediabetes in disguise.
What Experts Recommend Now
Doctors aren’t ditching A1C-they’re adding to it.
Dr. Richard Bergenstal, former head of the International Diabetes Center, says: “Time in Range should be your primary goal. A1C is your backup.” Time in Range means spending at least 70% of your day between 70 and 180 mg/dL. Below 70 should be less than 4%. Above 180 should be under 25%.
The American Association of Clinical Endocrinologists recommends an A1C target of 6.5% or lower for many patients-tighter than the ADA’s 7.0%. Why? Because studies show that even small reductions in A1C lower the risk of complications. But they also say: don’t chase a low A1C if it means frequent lows.
And the 2023 ADA/EASD consensus report introduced glycemic individualization. That means your target isn’t one-size-fits-all. A 25-year-old with no other health issues might aim for A1C 6.0-6.5%. A 75-year-old with heart disease might aim for 7.5-8.0%. It’s about balancing risk and quality of life.
How to Use Both Metrics Together
If you’re using a CGM, here’s how to read your data:
- Check your GMI (from your CGM app). It should be close to your lab A1C-within 0.3%.
- Look at your Time in Range. Are you spending 70% or more in 70-180 mg/dL?
- Check your Time Below 70. Is it under 4%? If it’s higher, you’re at risk for dangerous lows.
- Look at your Time Above 180. Is it under 25%? If it’s higher, you’re spending too much time in hyperglycemia.
- Compare your GMI to your lab A1C. If they’re more than 0.5% apart, talk to your doctor. Something’s off-maybe your CGM needs calibration, or your red blood cells are behaving unusually.
If you’re not using a CGM, check your blood sugar 4 times a day for 3 months: fasting, before meals, and 2 hours after meals. Calculate your average. Then compare it to your A1C using the eAG formula. If your average glucose is much lower than your eAG, you’re probably missing post-meal spikes.
And remember: A1C is a lab test. It’s not affected by what you ate yesterday. But your daily glucose numbers are. That’s why daily tracking matters.
What’s Changing in Diabetes Care
The field is shifting. In 2022, the FDA approved Time in Range as a primary endpoint in clinical trials-for the first time. That means drug companies and researchers are now measuring success by how much time people spend in range, not just by A1C.
By 2027, experts predict TIR will become the main target for treatment. A1C will still be used, but as a secondary check. Why? Because TIR tells you what A1C can’t: how stable your glucose is. And stability matters more than just the average.
Studies from the T1D Exchange show that using both A1C and GMI reduces treatment errors by 23%. That’s huge. It means fewer missed lows, fewer unnecessary insulin changes, and better outcomes.
Even big labs are adapting. LabCorp processes over 28 million A1C tests a year. But now, they’re integrating CGM data into patient reports. If you upload your CGM data, they’ll calculate your GMI and Time in Range alongside your A1C. You’re not just getting a number-you’re getting a story.
Your Action Plan
Here’s what to do right now:
- If you have diabetes and aren’t using a CGM, ask your doctor about one. Even 14 days of data can reveal patterns you’ve missed.
- Ask for your GMI if you wear a CGM. Don’t just look at your average-look at Time in Range, Time Below, and Time Above.
- Compare your lab A1C to your GMI. If they’re more than 0.5% apart, dig deeper.
- Don’t let a good A1C make you ignore lows. Hypoglycemia is just as dangerous as high blood sugar.
- Set goals based on your life. Aiming for A1C 6.0% might be too risky if you’re older or have heart disease. Talk to your care team.
Diabetes isn’t about hitting one number. It’s about living with stability. A1C gives you the big picture. Average glucose, GMI, and Time in Range give you the details. Together, they show you the whole game.
Is A1C more accurate than daily glucose readings?
A1C is more stable because it averages glucose over 2-3 months and isn’t affected by what you ate yesterday or how stressed you were. But daily glucose readings show real-time patterns-like post-meal spikes or nighttime lows-that A1C hides. Neither is more accurate; they show different things. Together, they’re powerful.
Why does my CGM average say 140 mg/dL but my A1C is 7.2%?
That’s normal. The eAG formula converts 7.2% to 154 mg/dL. If your CGM shows 140 mg/dL, you’re likely having frequent highs that your meter isn’t catching-maybe after meals or at night. Your CGM might be averaging out spikes, or your meter checks are too infrequent. Try checking 2 hours after meals for a week and compare.
Can I trust my A1C if I have anemia?
Not reliably. Anemia, especially iron-deficiency or hemolytic types, can make A1C falsely low or high. If you have anemia, your doctor should use fasting glucose or oral glucose tests to diagnose or monitor diabetes. CGM-derived GMI is often more accurate in these cases.
What’s the best A1C target for me?
There’s no universal target. For most adults, under 7.0% is standard. But if you’re older, have heart disease, or get frequent lows, your target might be 7.5-8.0%. If you’re young, healthy, and have type 1 diabetes, you might aim for 6.5%. Talk to your care team. Your goal should be safety and sustainability-not just a low number.
Do I need a CGM if I’m on insulin?
Yes-if you want to avoid dangerous highs and lows. CGMs reduce hypoglycemia by up to 40% in people on insulin. They show trends, not just numbers. If you’re checking blood sugar only 2-3 times a day, you’re missing 99% of your glucose data. A CGM gives you the full story.


Christina Bischof
December 16, 2025 AT 09:37Also my GMI was 7.1% which made me panic until I realized my spikes were insane after pasta. Life changed.
Lisa Davies
December 17, 2025 AT 22:20Cassie Henriques
December 18, 2025 AT 12:13Melissa Taylor
December 18, 2025 AT 17:38Nupur Vimal
December 19, 2025 AT 16:26Sai Nguyen
December 21, 2025 AT 05:10Michelle M
December 22, 2025 AT 13:46John Brown
December 24, 2025 AT 05:14Jake Sinatra
December 26, 2025 AT 00:44Jocelyn Lachapelle
December 26, 2025 AT 16:51John Samuel
December 28, 2025 AT 01:28